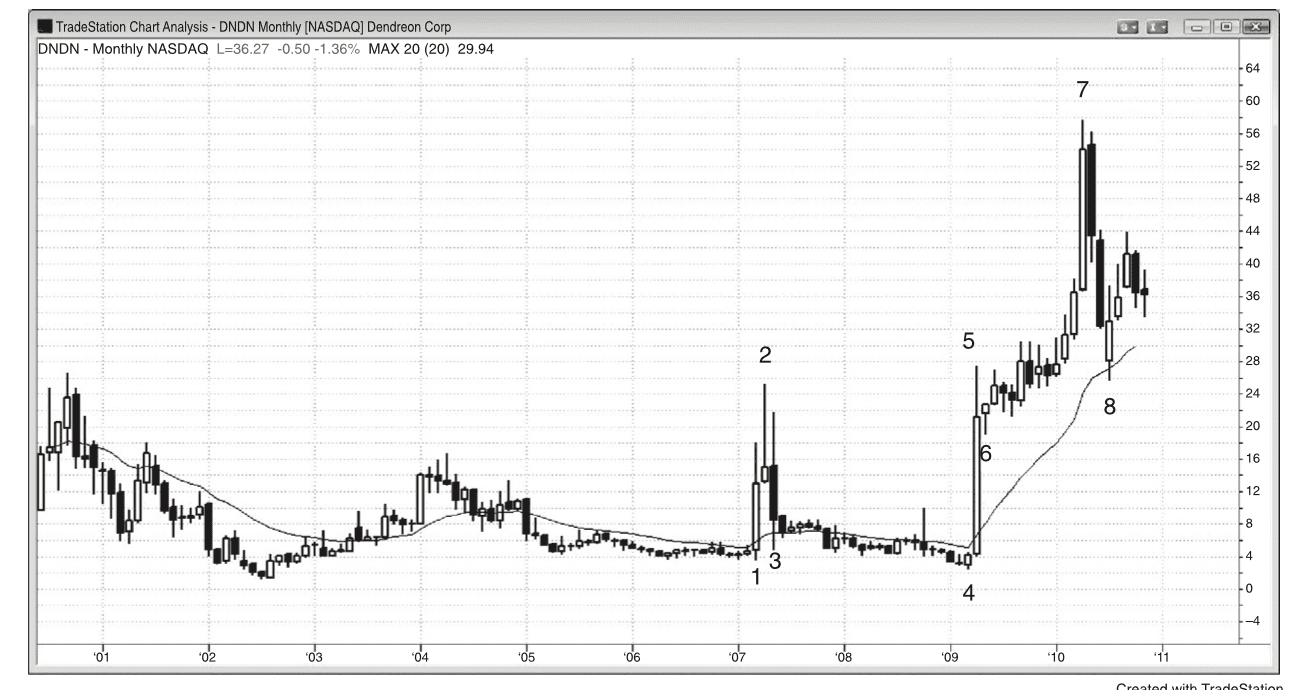
Chương 22 — Hình minh họa
Figure 22.1 — Price Action Has Not Changed over Time
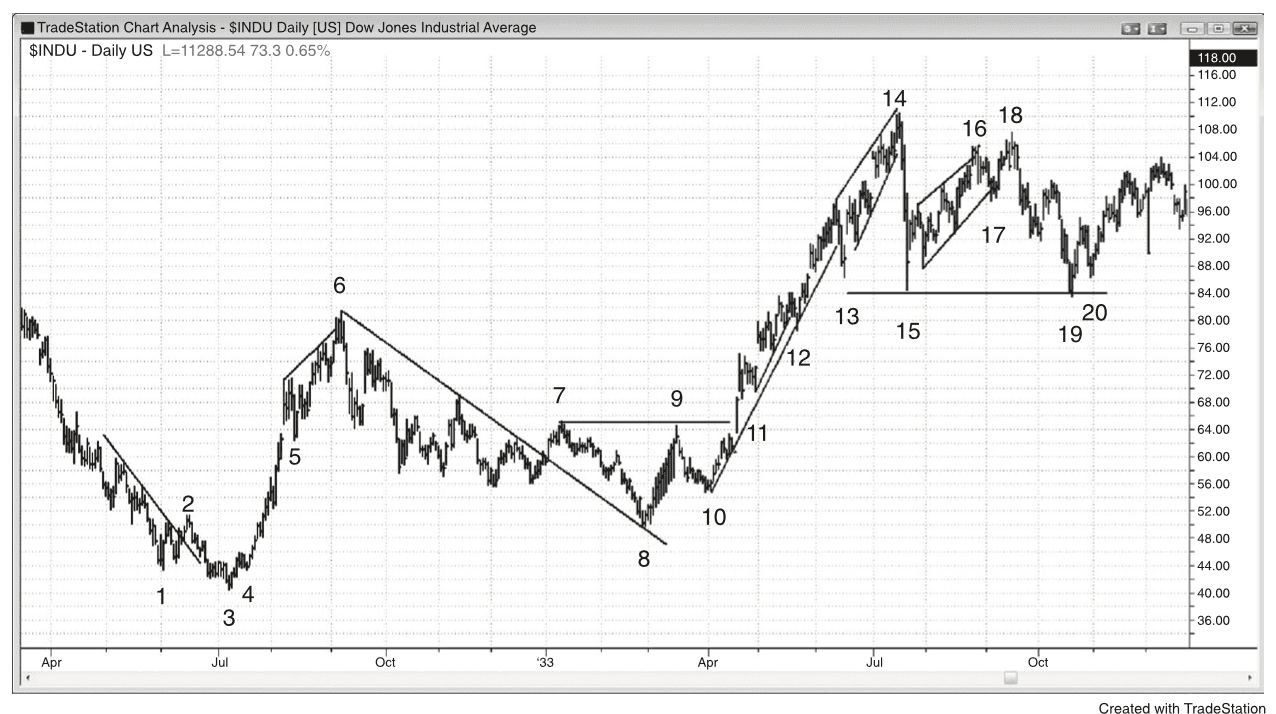
Figure 22.2 — Gap Pullbacks
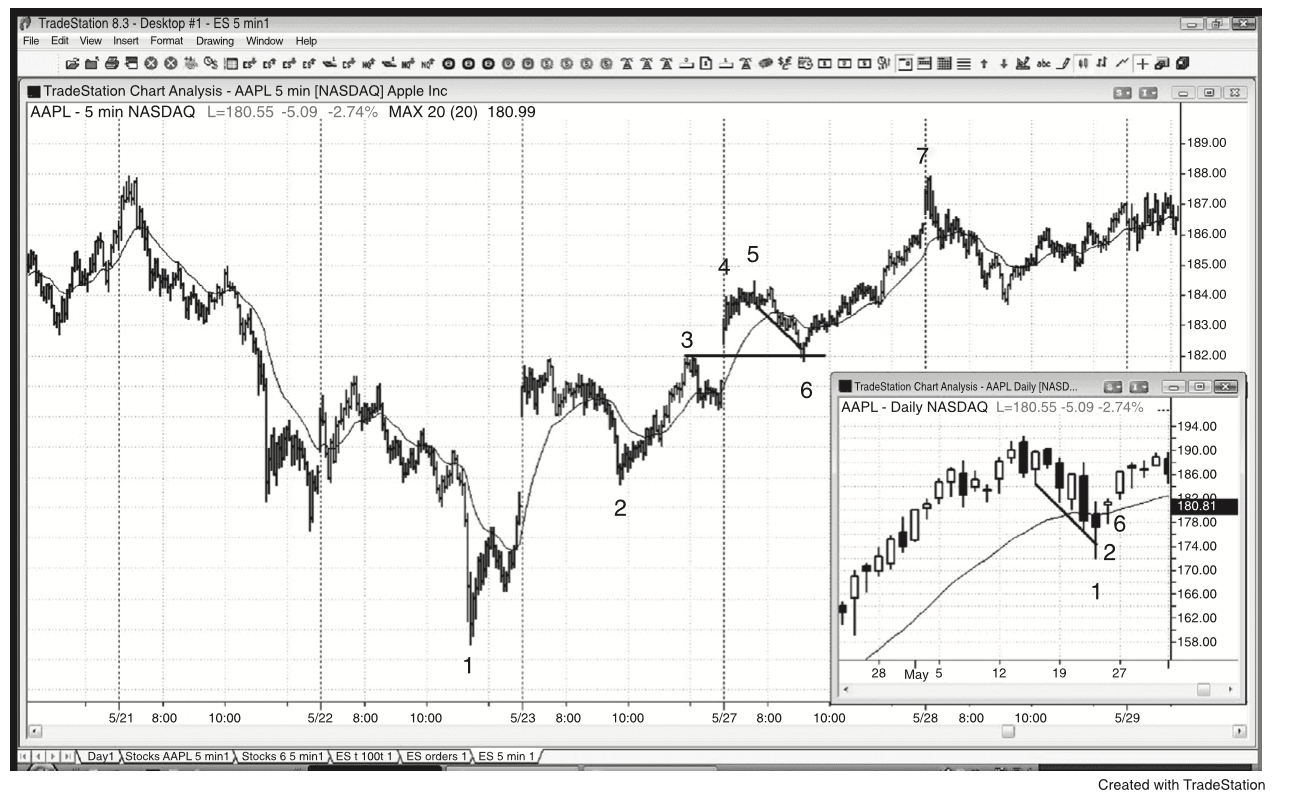
Figure 22.3 — The Weekly SPY
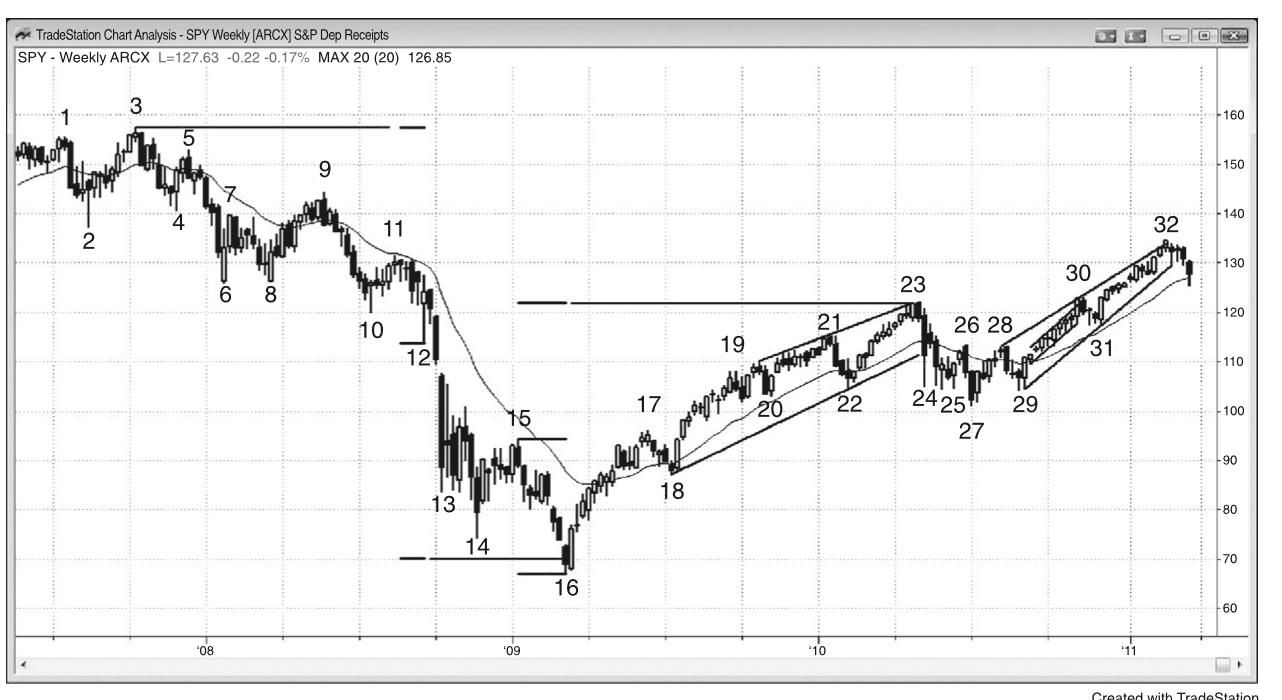
Figure 22.4 — Monthly Gold Wedge Channel
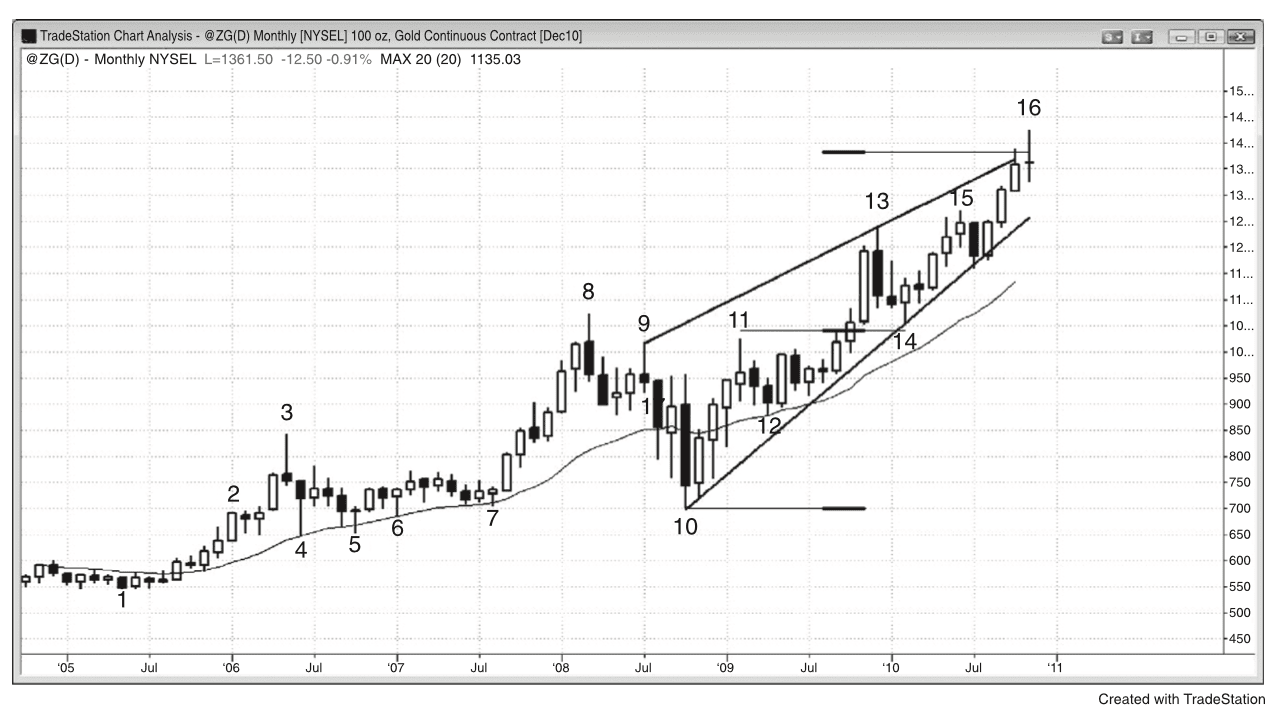
Figure 22.5 — Monthly Dollar Index Futures
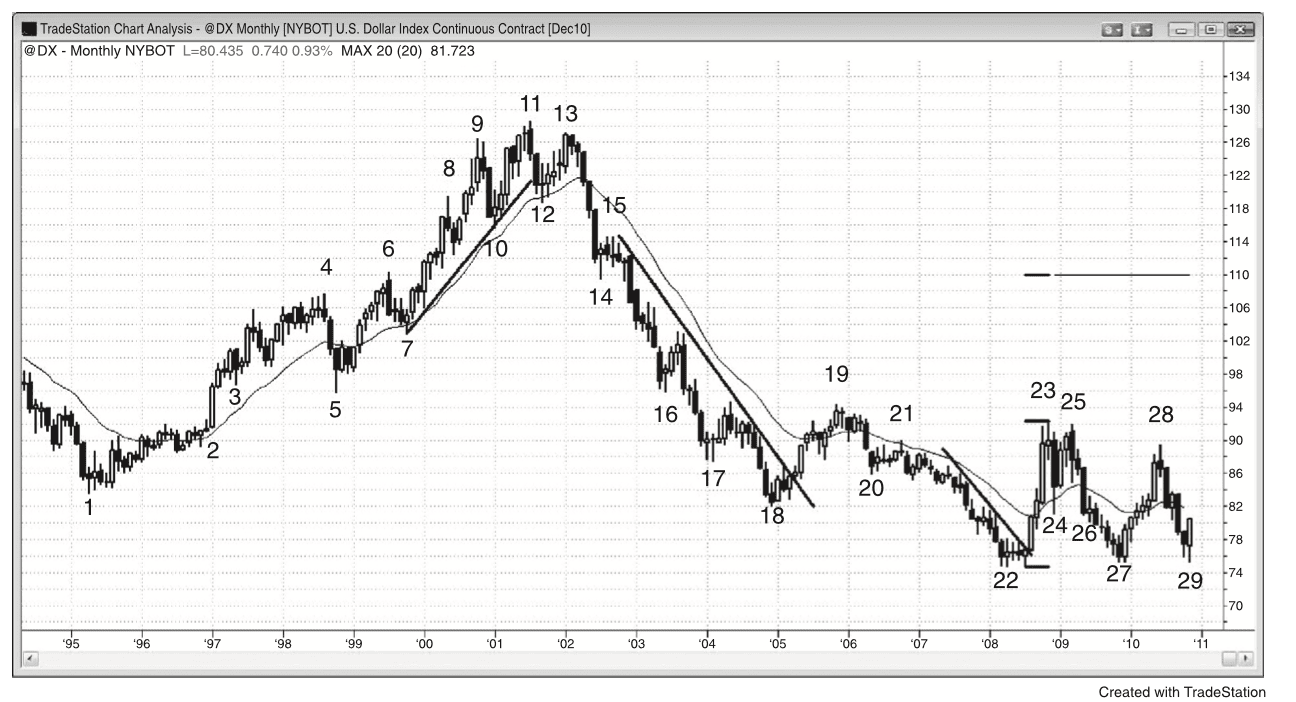
Figure 22.6 — Round Numbers Can Be Support and Resistance
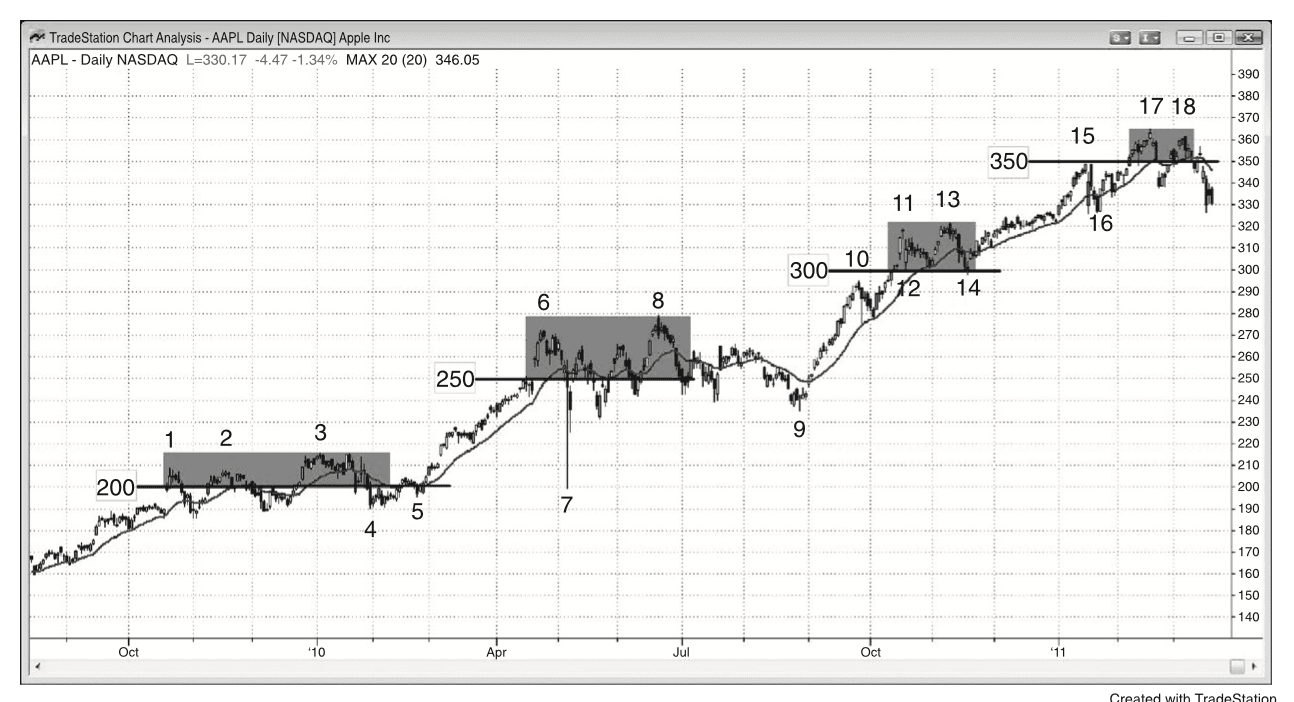
Figure 22.7 — The Daily and Monthly Charts Can Be in Opposite Trends
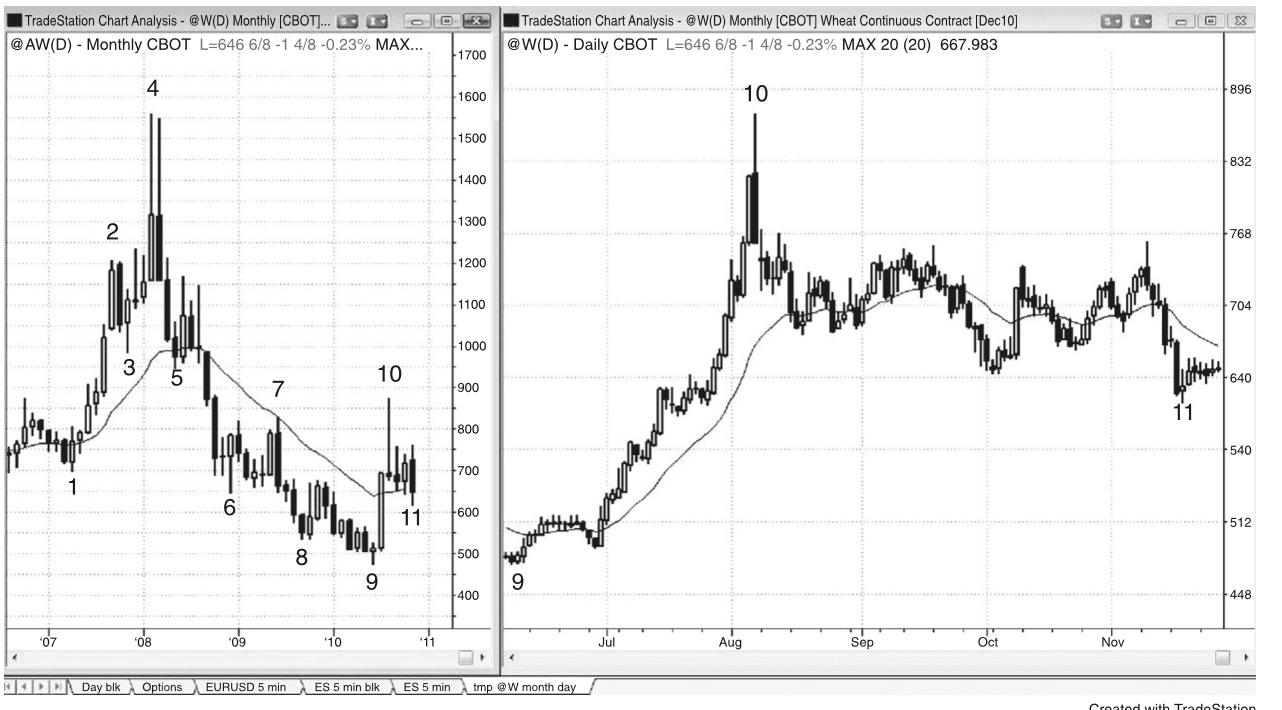
Figure 22.8 — News Can Move a Stock