Chương 9 — Hình minh họa
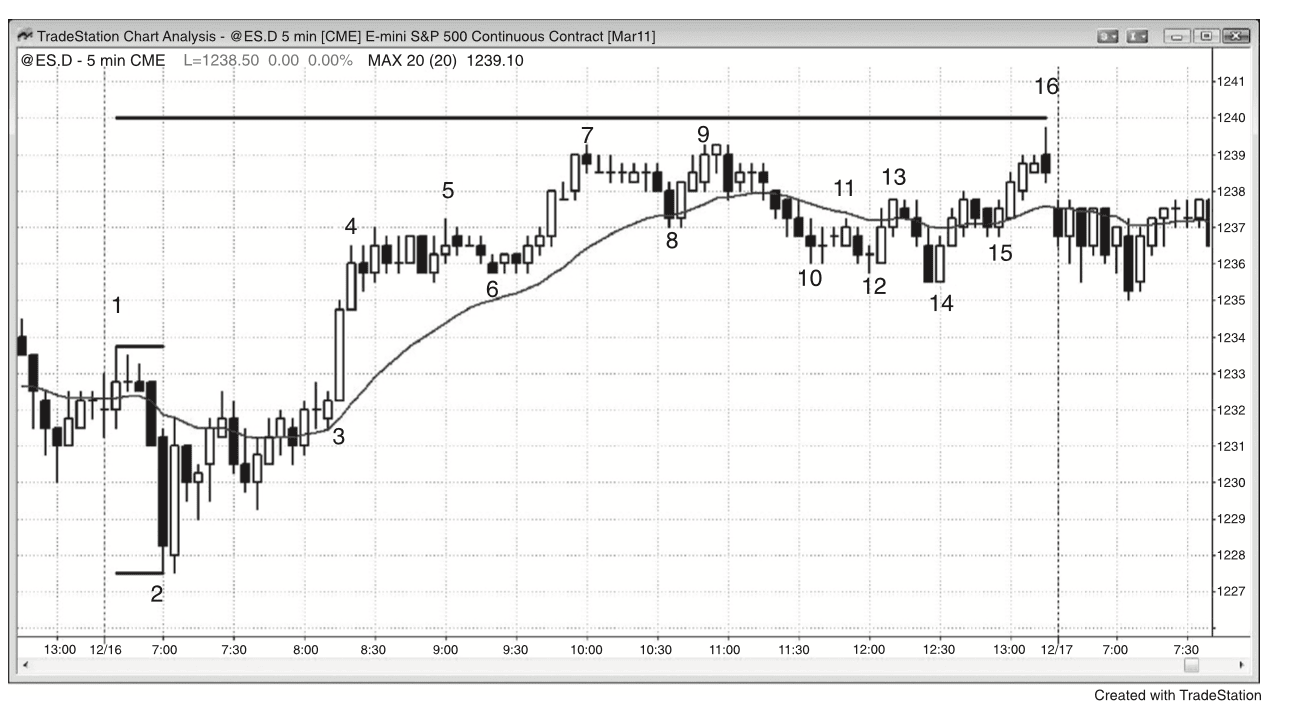
Figure 9.1 — Small False Breakouts
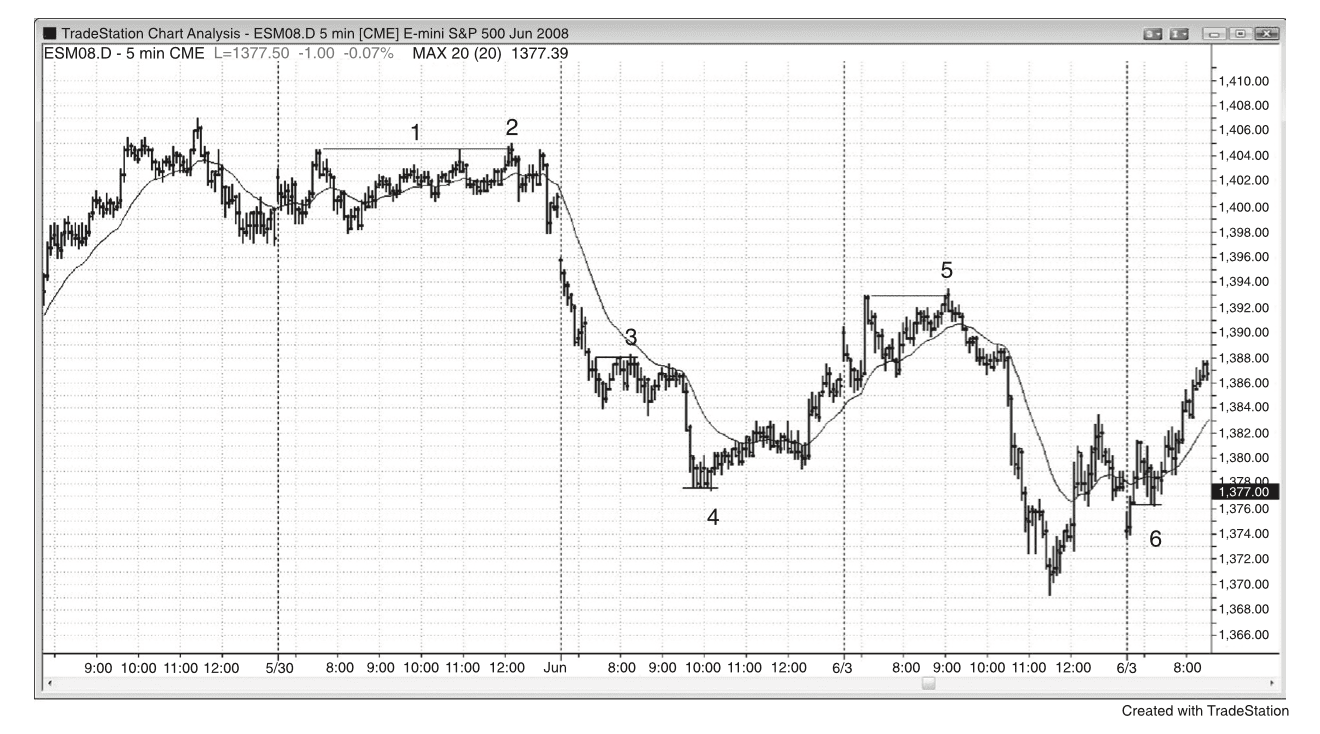
Figure 9.2 — One-Tick Traps in the Emini
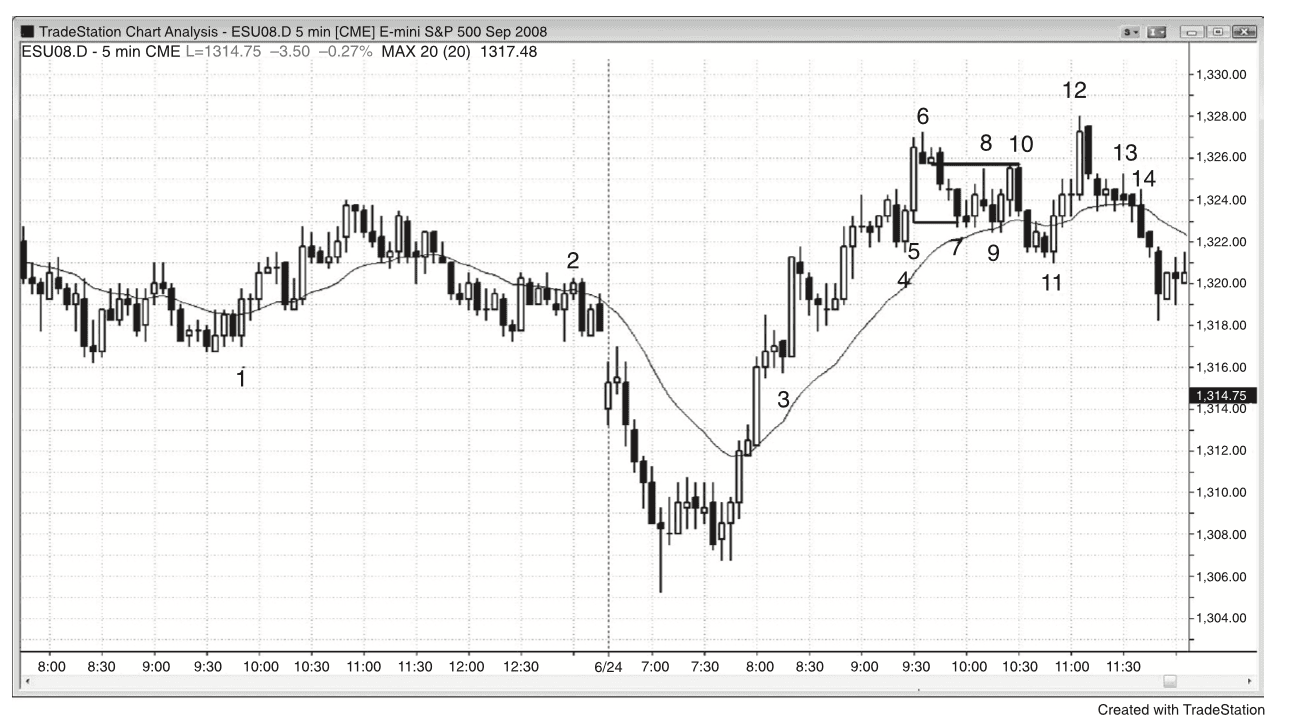
Figure 9.3 — Breakouts beyond Signal and Entry Bar Protective Stops
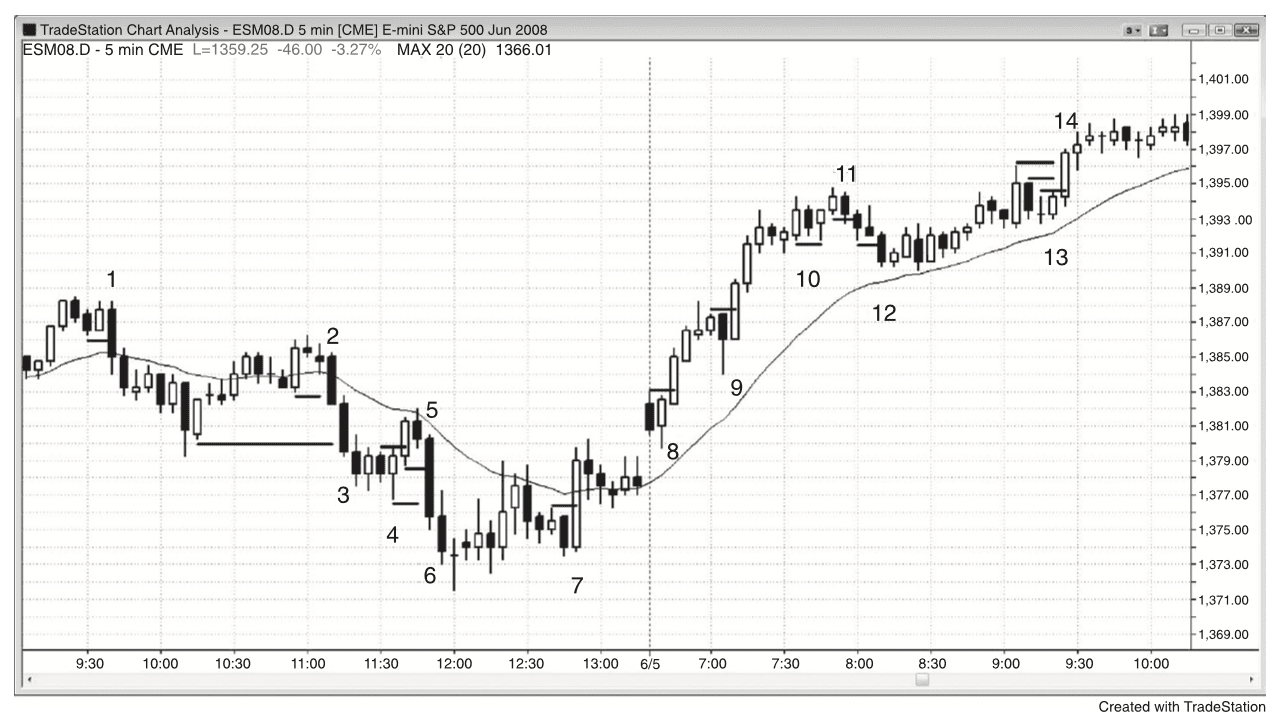
Figure 9.4 — Failed Profit Targets
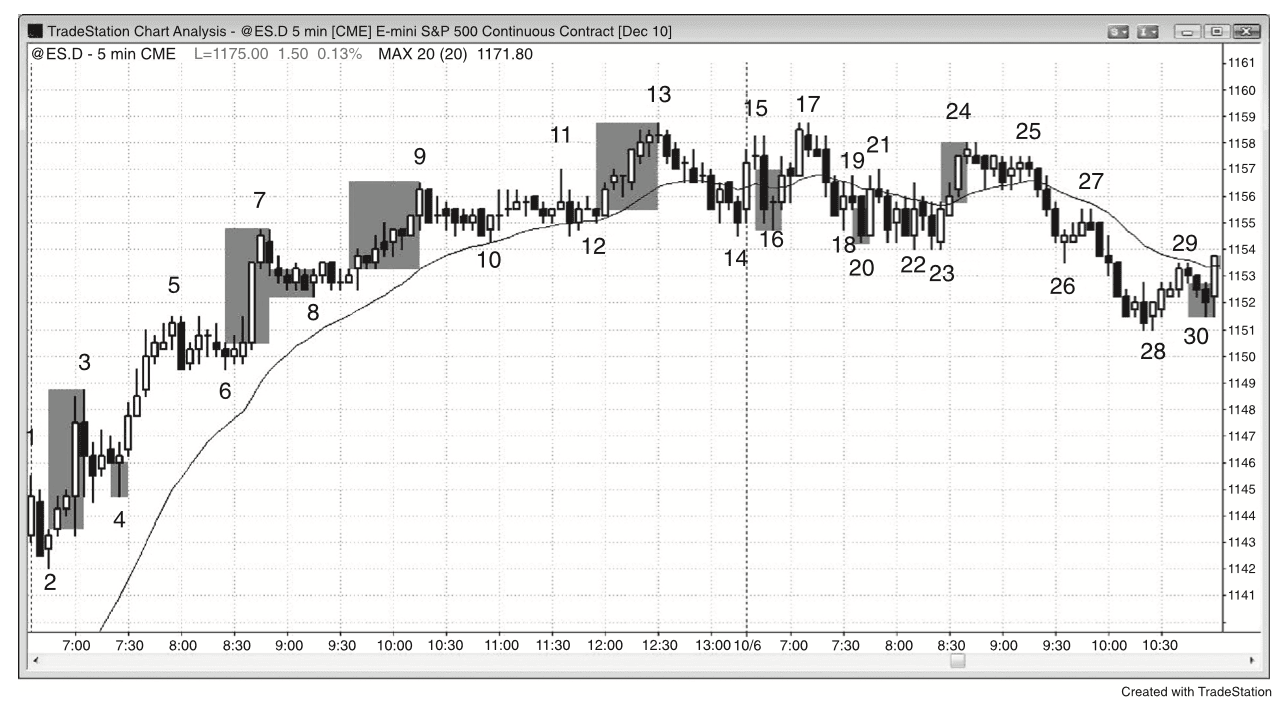
Figure 9.5 — Trading Range Breakouts Usually Fail
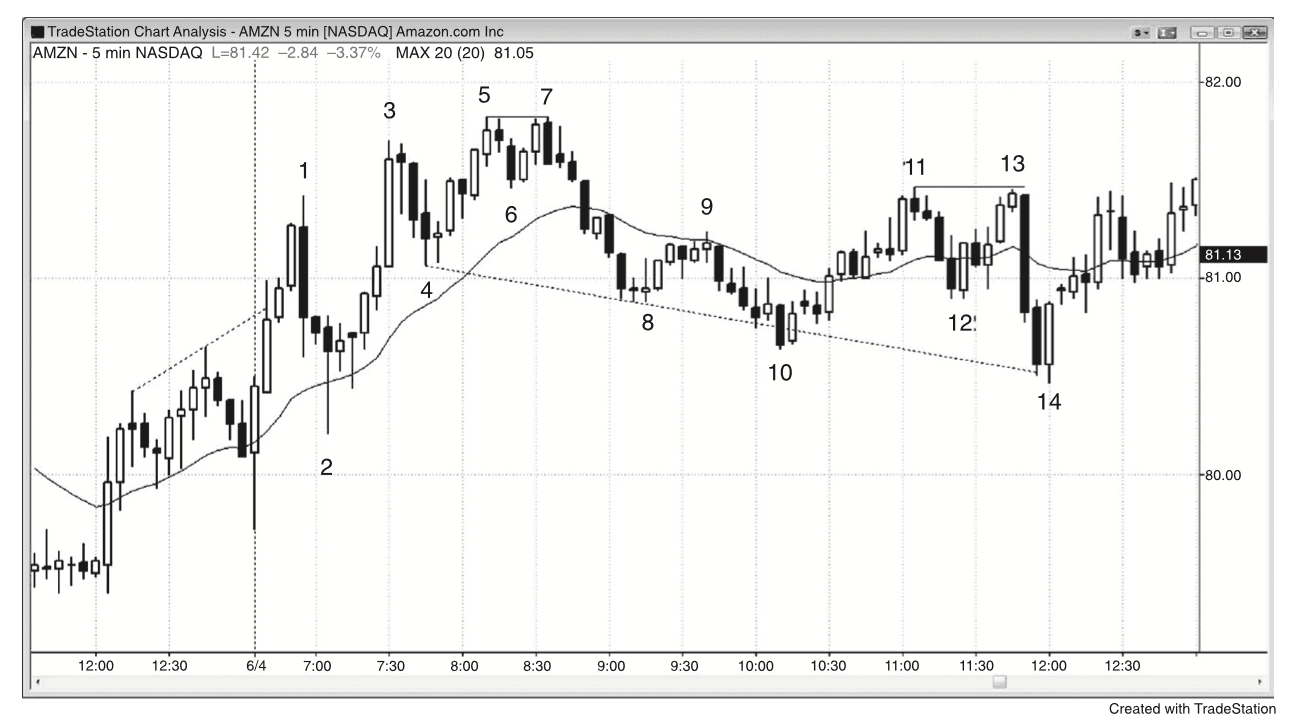
Figure 9.6 — Failed Breakouts in AMZN
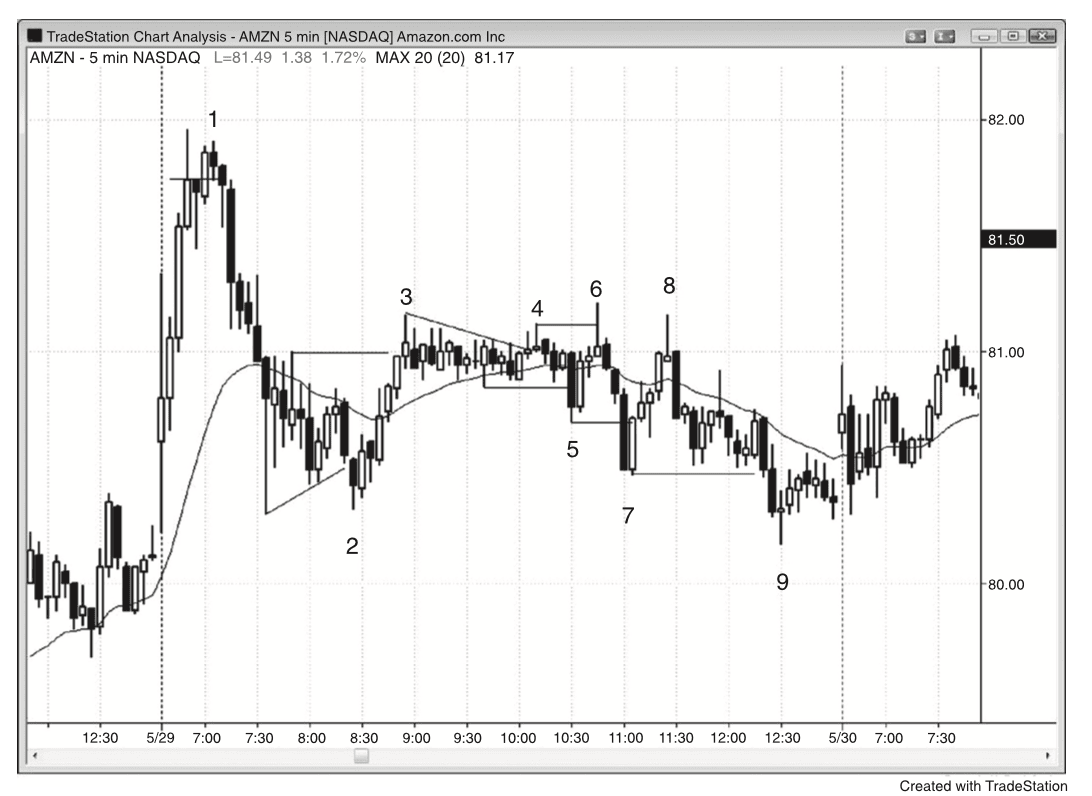
Figure 9.7 — Trading Range Breakouts Usually Fail
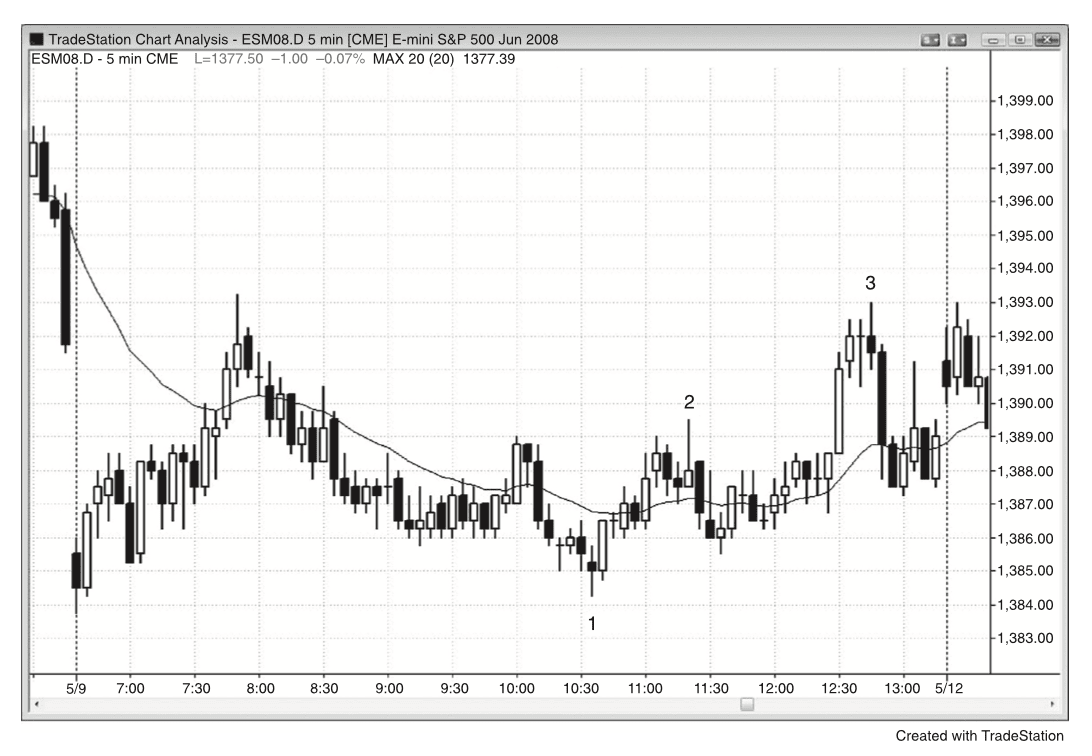
Figure 9.8 — Trapping Traders out of Good Trades
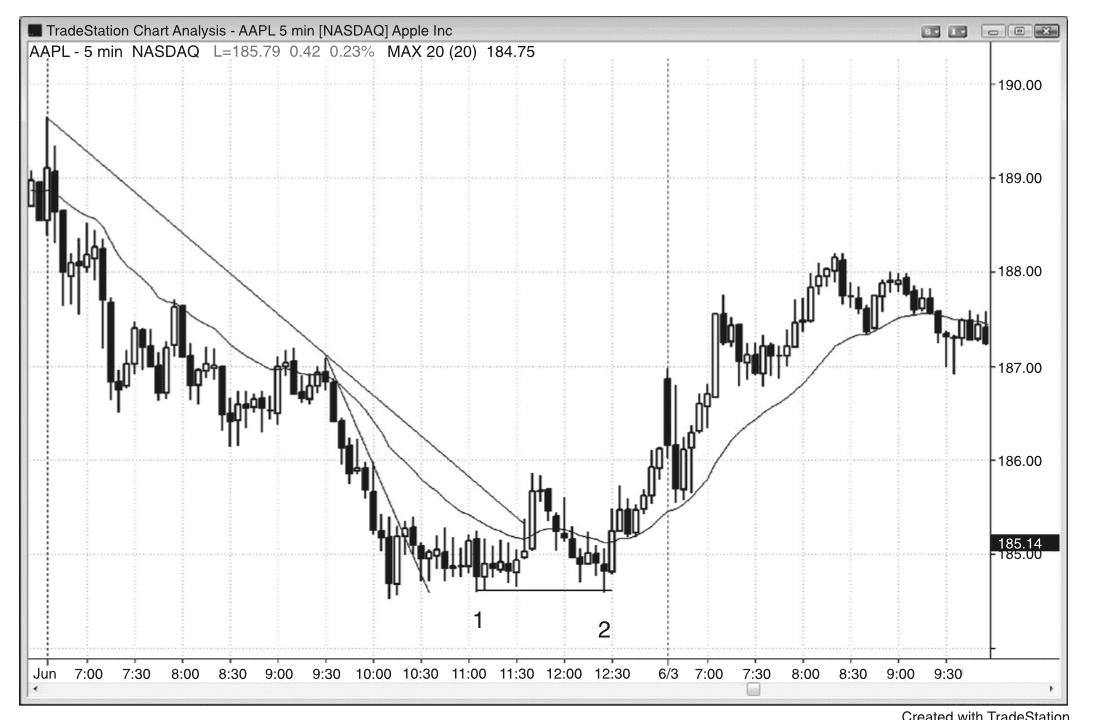
Figure 9.9 — Double Tops and Bottoms in the First Hour
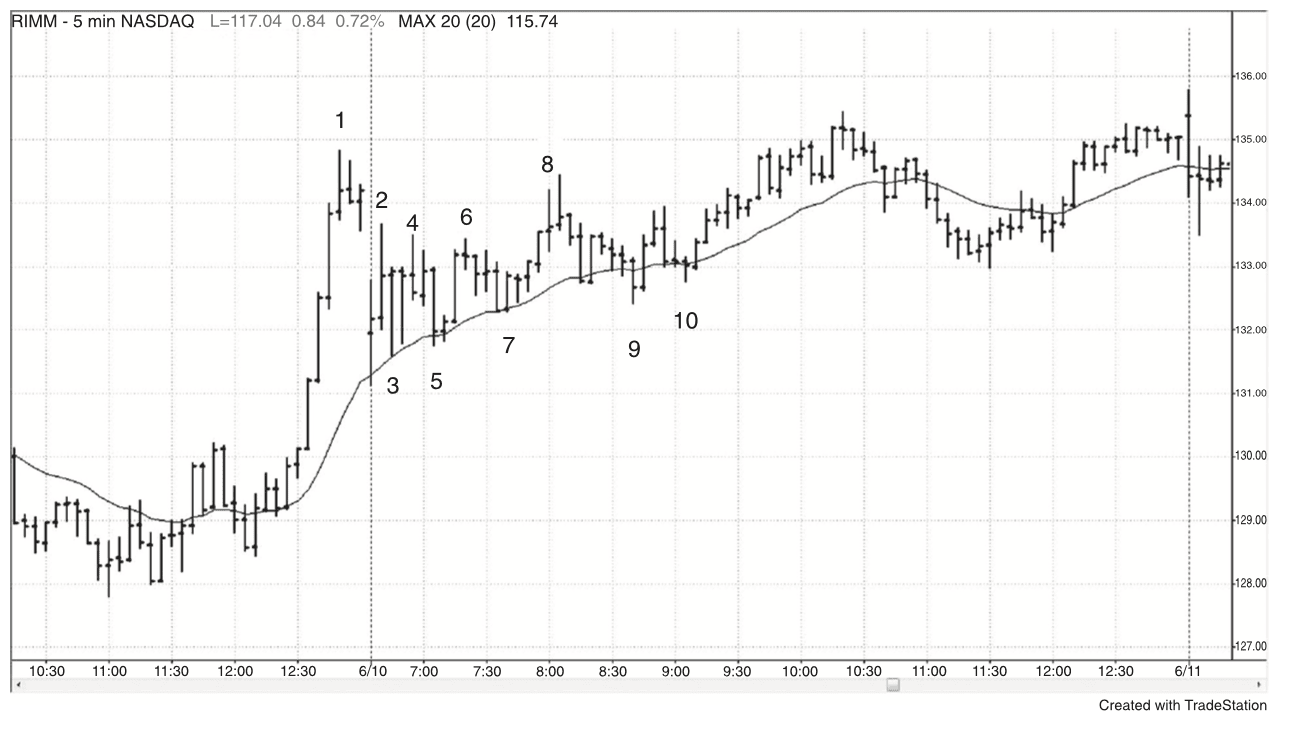
Figure 9.10 — Failed Double Bottom Bull Flag
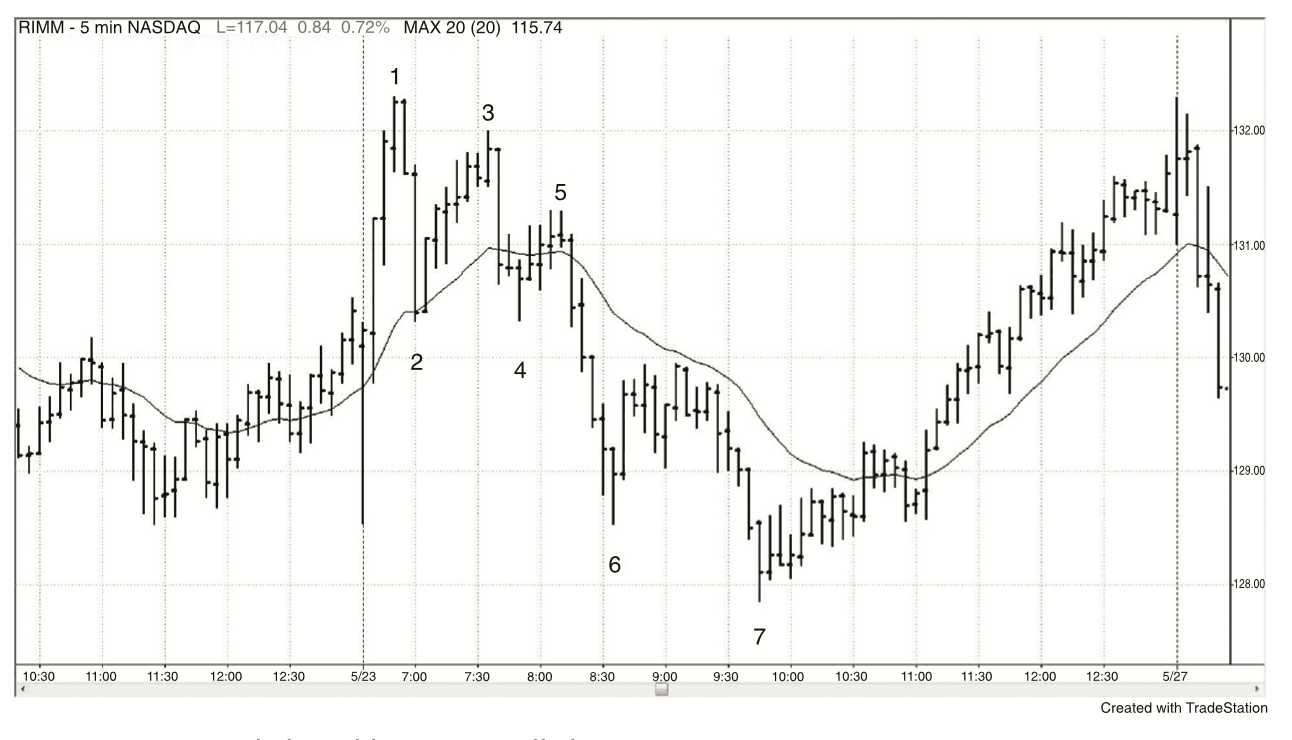
Figure 9.11 — Most Head and Shoulders Patterns Fail
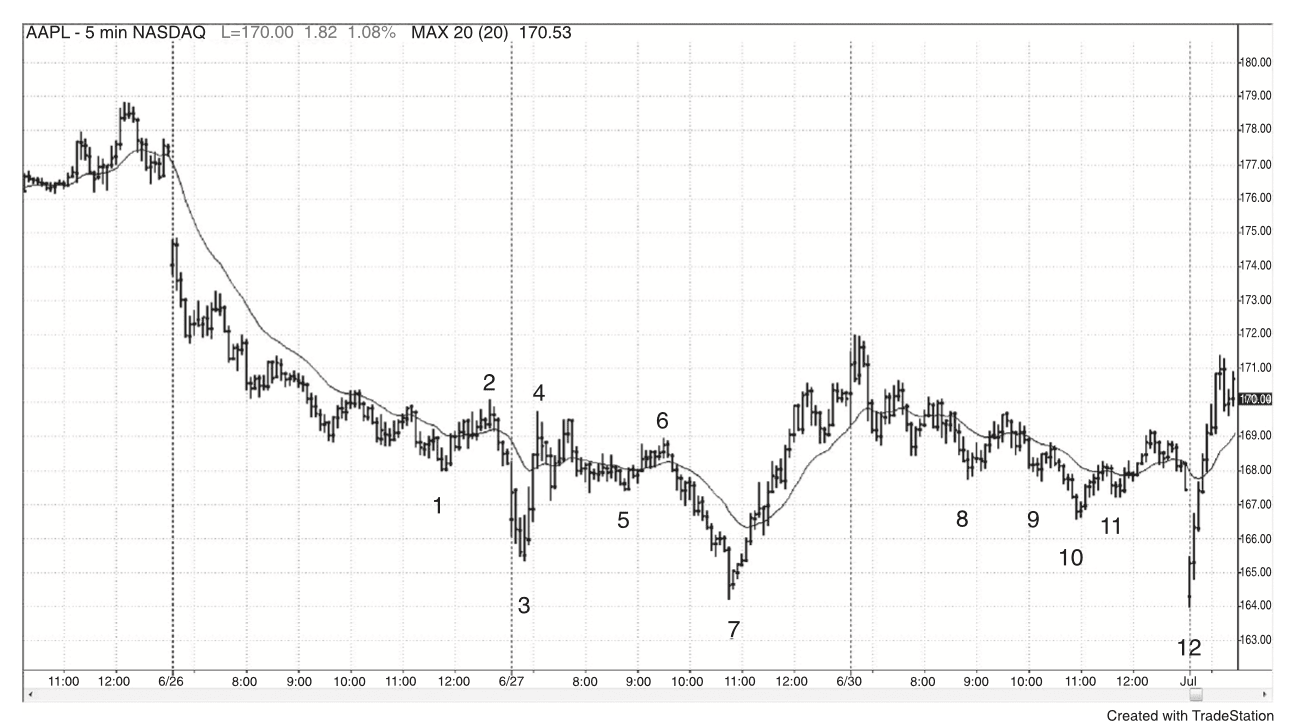
Figure 9.12 — Two-Legged Test of Trend Extreme
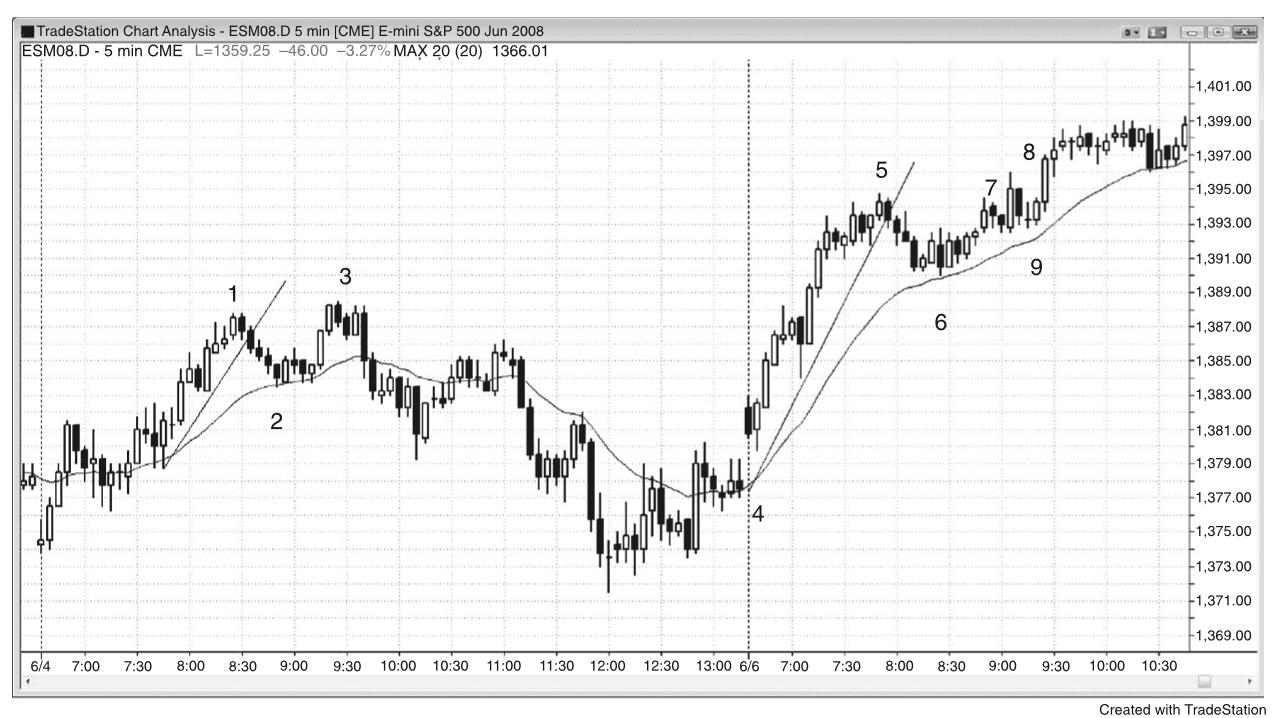
Figure 9.13 — Five-Tick Failure
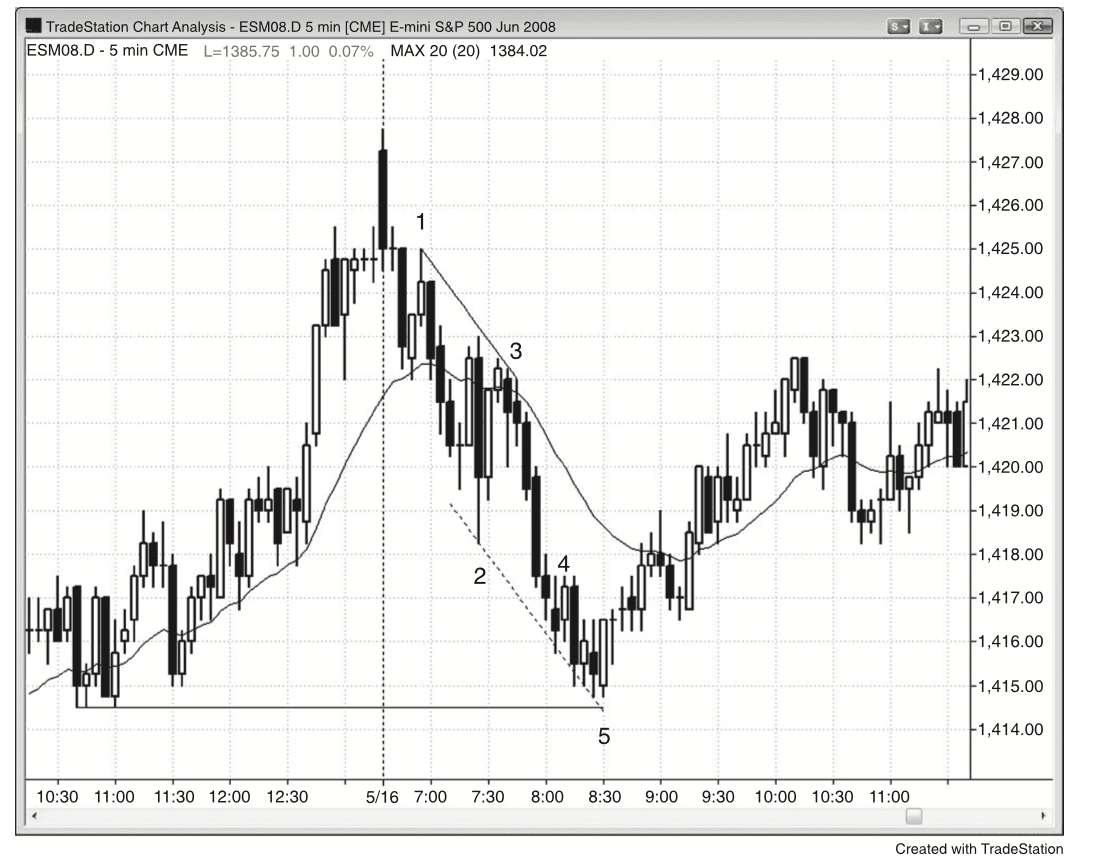
Figure 9.14 — Failed Signals in QQQ
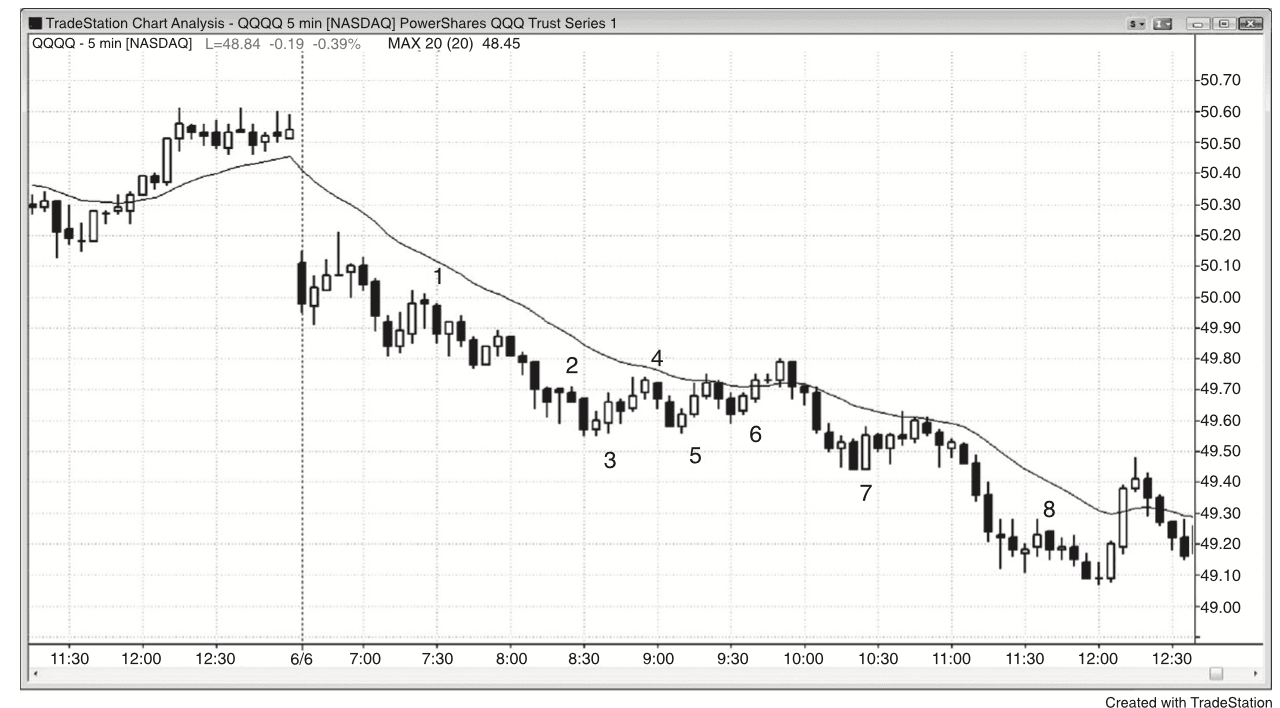
Figure 9.15 — Switch to a Smaller Target
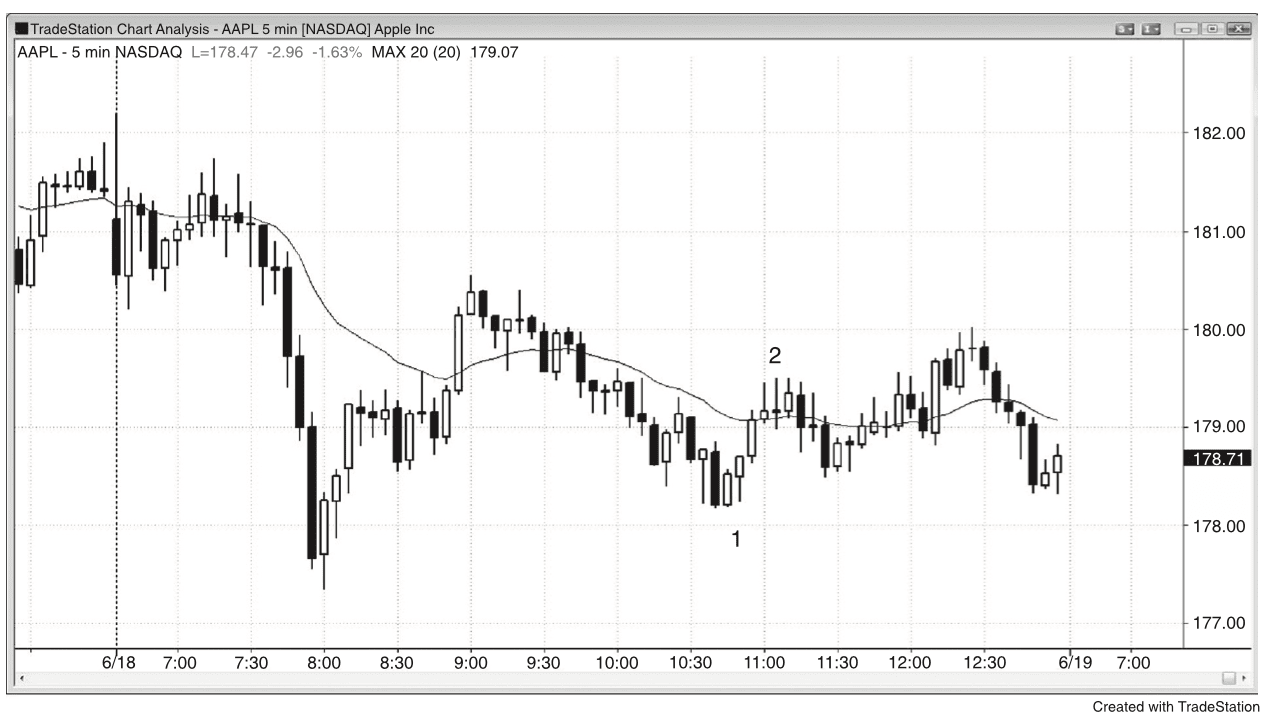
Figure 9.16 — A Bear Spike Can Be a Buying Opportunity
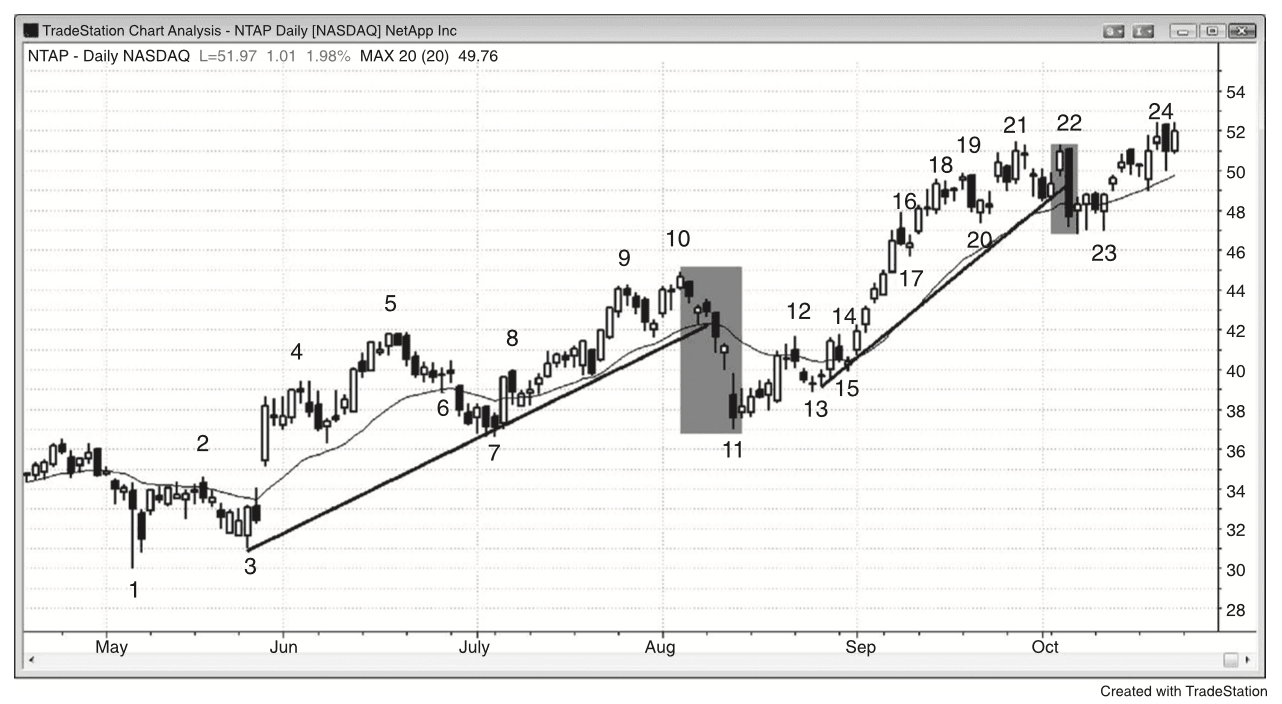
Figure 9.17 — Most Trend Reversal Attempts Fail
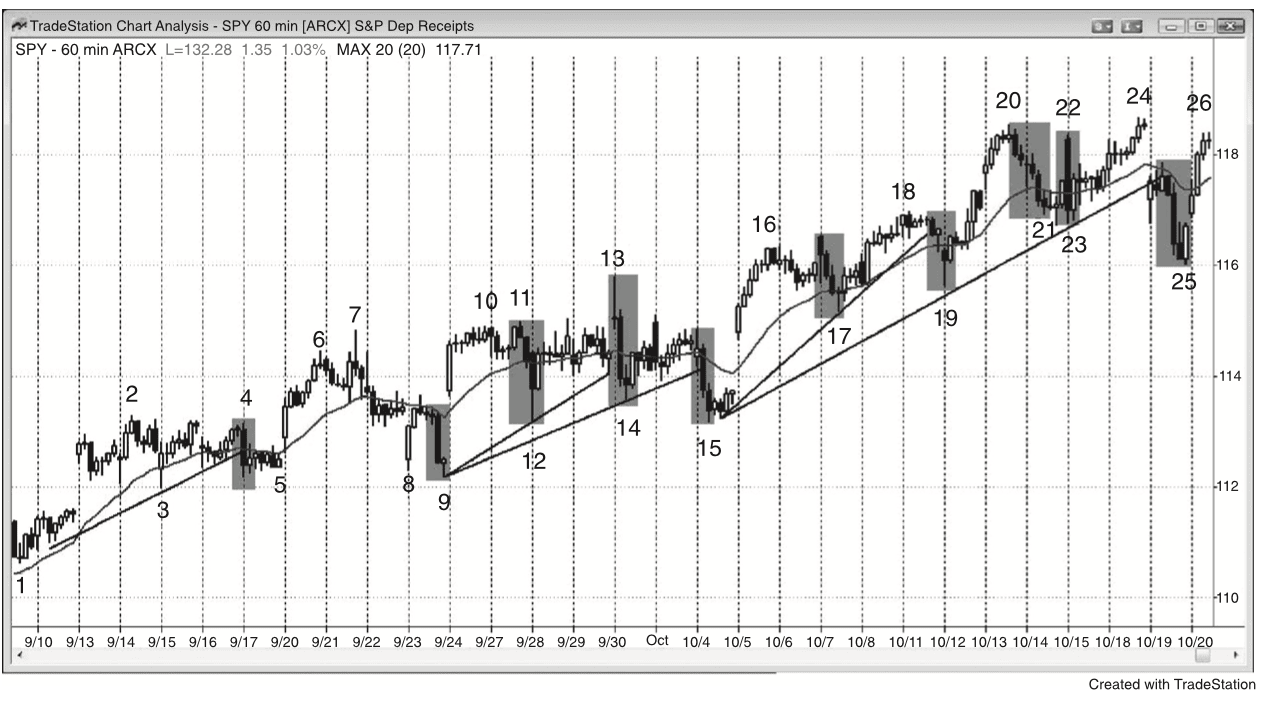
Figure 9.18 — Failures Can Sometimes Be a Sign of Strength
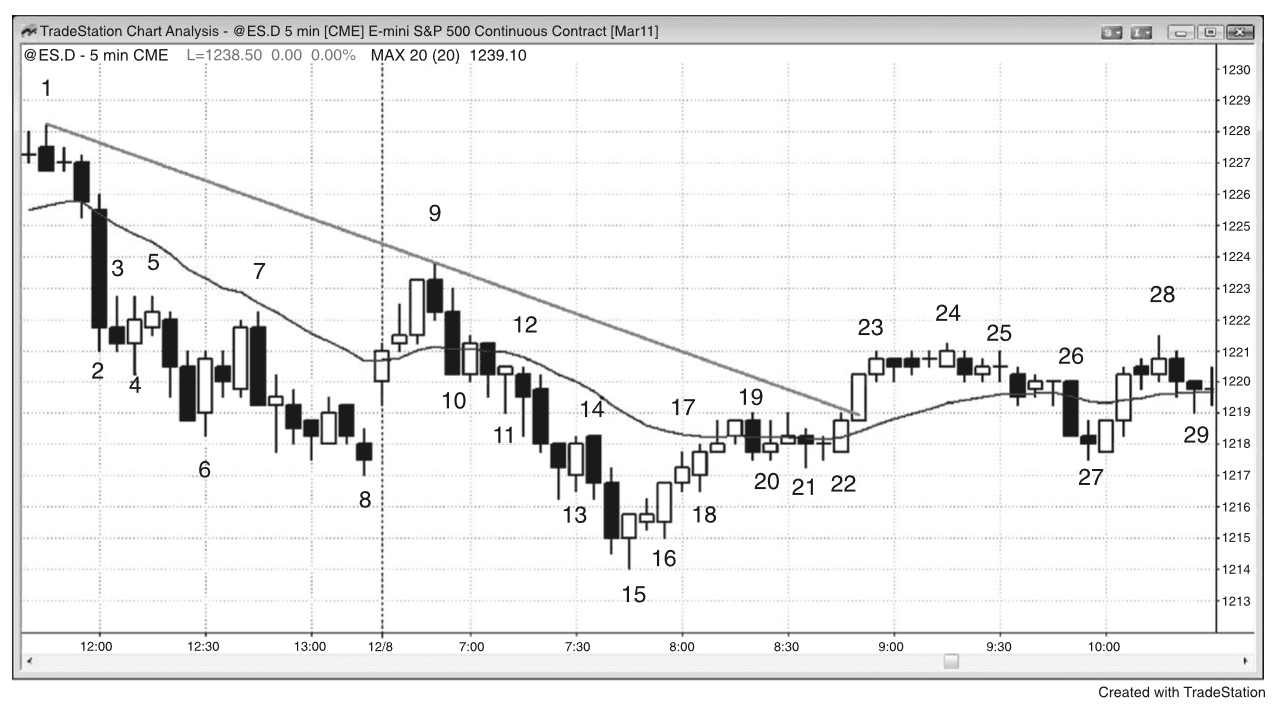
Figure 9.19 — Just Missing a Target and Then Reaching It